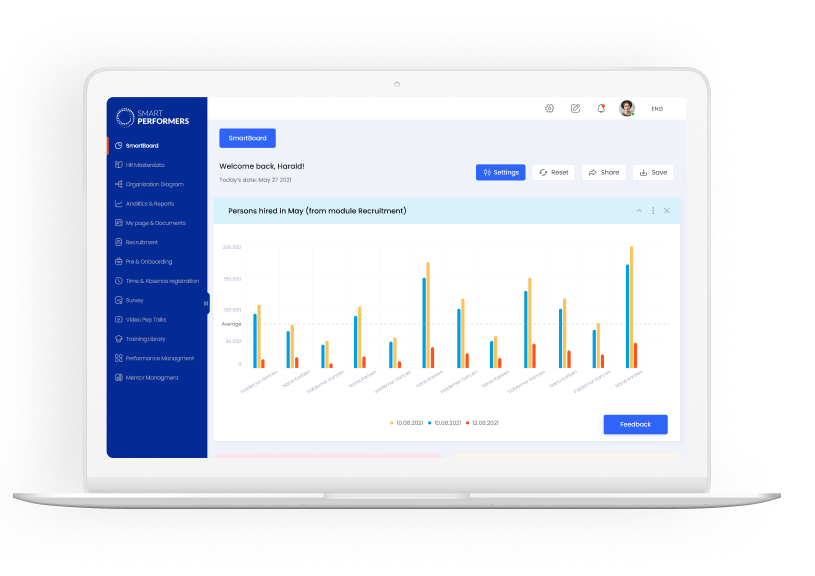
SmartBoard allows you to present individually designed reports and notifications.
Companies invest, in these years, heavily in multiple systems and processes to improve customer and employee satisfaction, but without one single overview of all the relevant data this investment will not be fully capitalized.
Whitepaper. The digital reporting solution powered by CC-Interactive
Within the field of Business intelligence software the SmartBoard stands out since it is truly digital. The solution uses
Automated Data Collection and data visualization.
SmartBoard enables enterprises to Process and Visualize Data without traditional It integration.
Introduction
Are you ready to utilize your business data for exceptional business insights? Do you want to win investors with impeccable ESG reports?
Our smart Business Intelligence Software can help you to accomplish all these with ease and comfort.
Let’s find out why SmartBoard would be your ideal companion in fulfilling all your data analytics, KPI reporting , data collection and visualization goals.
SmartBoard makes Collecting and Visualizing Data More Convenient
One thing that separates SmartBoard us from the average business intelligence tools is the RBI (Robotics Business Intelligence) technology. Usually, BI Tools use a manual data collection method that involves human operators.
Our AI-assisted BI tool, however, uses software robots instead which transforms the entire process! The traditional coding takes a lot of time while coding performed by software robots is flawless and a lot less time-consuming.
So you get a rapid data collecting and visualization performance.
Some of the major benefits of robot-assisted data processing, robots works 24/7 without any breaks, delivers 100% accurate results and the process does not require internal IT ressources.
Especially for financial reporting SmartBoard has shown its values since any data from all kinds of legacy systems can be presented withour hassle or time consuming IT integration
Plenty of Data Visualization Options
SmartBoard offers you plenty of data presentation models for your KPI reports, you can use the one that suits your requirements.
From column chart, bar graph, stacked bar graph, line graph, and dual-axis chart to pie chart and radar/ scatter plot, you’re getting all the information presentation models all in one place .
Another benefit to keep in mind is that you won’t require extremely difficult procedures to switch to different visualization options. You can change your data visualization from a graph to a chart with just a click. And you can generate a specific KPI report , management report, accounting report using this unique ditital business intelligence software
You won’t have to manually rearrange the whole information from scratch, instead, the program will automatically organize the data to your preferred model instantly.
It makes demonstrating the data a whole lot easier and simplifies complicated information for everyone to understand easily.
One further of the key features are the ability to generate specific user business insight reports consisting of data from several different business areas such as KPI, accounting data, management performance, employee performance or sales performance data.
Increase your Understanding of your Customers’ Mindset and needs by KPI and business insights.
SmartBoard helps companies understand their customers better by providing them with relevant information about their needs, behavior, and preferences using reliable digital reporting, business reporting or management and financial reporting. This helps them to serve customers better and improve customer retention rates, which is often one of the main Key Performance Indicators ( KPI) .
Developing ESG Reports
SmartBoard is an automatic reporting platform that uses robots to gather information from various sources, analyze it and present it in a way that helps decision-makers understand how their operations are affecting the environment and society around them. With SmartBoard you can report online on Environmental Social Governance performance- so that you can improve the actual performance before publishing the annual ESG report. In this way data is transformed into actionable business insights in the area of ESG.
This process enables organizations to make informed decisions about their operations so that they can improve their ESG performance and become more sustainable in the long run.
As the typical manual collection of vast amounts of data required for ESG reports is incredibly time-consuming and expensive, we use specially programmed software robots to collect the data and build a digital ESG report for you. This saves a lot of time, hassle and enables you to act on the business insights from the BI solution.
So, you get to comply with the EU regulations and attract new investors at the same time using the incredibly user-friendly ESG reporting technology by SmartBoard!
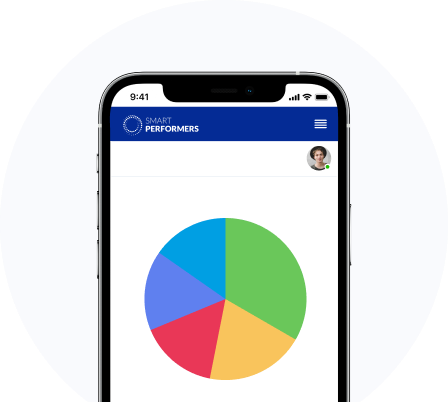
Data Accessibility for Added Flexibility
SmartBoard offers you the freedom of data accessibility via the Mobile Dashboard. You can view your dashboard anywhere, anytime. This gives you the flexibility to keep yourself updated with all the information at hand and make decisions based on the information at any moment. Such KPI reporting, business insights or management reports can also be presented to anyone without being in a professional setting via the mobile app.
The KPI Reporting enables you to Make Informed Business Decisions and act on the business insights in real time.
SmartBoard provides accurate KPI reports that help managers make decisions based on business insights and online management reporting. For example, a company may want to know which products have the highest production costs so that it can compare different products and decide which ones should be produced in greater quantities. SmartBoard collects data and present the relevant performance indicators so better decisions can be made.
Data Comparison Capabilities
Comparing data groups by years or months helps organizations assess the business progress or implement corrective actions. These business insights provides crucial information for the management reporting and optimal decisions.
And that’s exactly what SmartBoard is all about!
Using SmartBoard you can easily compare data groups by months or years. It will give you profound business insights into how your business is doing and help you determine and adopt appropriate business strategies for success.
Business Analytics
Business analytics is the process of using data to make informed business decisions in order to improve business performance. Therefore, business intelligence software is often used to collect and visualize such data.
SmartBoard revolutionizes the whole process with a simple-to-use interface and precise analytics output.
Businesses need to make decisions regularly, often in response to new market conditions or changes in customer behavior and this requires typically business insights in real-time or relevant KPI reporting.
In order for these decisions to be made, they must be based on accurate information about the market, their competitors, their customers, and the product or services being offered.
Our business analytics tools and key performance indicators is typically used to brief management with the required management information and business insights on various aspects of the company. Which allows them to make better-informed decisions
Fast Implementation and Data Safety
The best part about SmartBoard is that the implementation doesn’t take long. In a few weeks to a few month your business intelligence software solution will be ready to present business insights or KPI data for you, which makes it easier for the organization to act on the provided information in realtime.
Our data collection, storing, visualization, and transfer, all are done following the guidelines and regulations is of course fully GDPR compliant.
Our Business intelligence software solution can either be deployed on premises or as a secure cloud-based solution. This ensures that you will receive the KPI reports and business insights without risk of data breach.
SmartBoard- The digital Business Intelligence software solution
SmartBoard provides the relevant business insights for performance reporting or management reporting.
Additionally, the business intelligence software solution can be used for ESG reporting , which has recently become extremely relevant by the EU requirements that all companies above 500 employees mush publish an ESG report each year.
Smartboard transform your data into business insights and KPI reports with the digital reporting solution.
One of the key advantages is the fully automatic data collection which enables you to act on the digital business insights you receive from our BI solution. We use a fully digital data collection method with Software Robots doing the work. And all the data is presented in the KPI dashboard and makes your business and management reporting simpler and less time consuming.
SmartBoard creates one single overview of the selected data by using Robots to collect data. This allows you to focus on your area of expertise.
Create you own KPI Dashboard or use it for ESG reporting.
Access to your personalized dashboard anywhere. Stay tuned on the go with SmartBoard.
With SmartBoard you are able to have one single overview of all data without having to create a cumbersome IT project.

SmartBoard allows each manager to take informed decisions by having the relevant data presented in realtime. Each user can create own individual dashboards and give each topic a separate color to visually distinguish the different topics.
For a Head of Sales some typical dashboards would be one with sales performance data and one with employee data each in different colors.
Get startedSelected benefits from a SmartBoard implementation:
We have a team ready to help you – send us a mail at info@smartperformers.com and we will get back to you.
CCI Group has HQ in Denmark and has for the last 20 years been delivering lifecycle management solutions within Customer Engagement and Human Resources. CCI Group was founded in 2000 by IT entrepreneur Harald Riis Thomsen. We use Artificial Intelligence to improve employee engagement and performance in a cost-efficient manner.
We believe that real growth comes from engaged employees and satisfied customers, so if you want to grow fast, contact us, by sending a mail to info@cc-interactive.com